weChook Racing: How we use data in the pits

Having covered how Ian uses our measured data whilst out on circuit in the last post (read it here: https://wechook.com/?p=518 ), I’m now going to cover what we can do with it when we’re not racing – be it in the pit lane or once we’re back home.

The first step is getting the information from the car to my laptop. As long as we remember to put it in, the telemetry board will record all measurements to a text file on an SD card, which can then be easily transferred across to a computer. The system also transmits data live wirelessly during a race, but this is of little use when the car goes out of range or behind a tree – pretty much everywhere apart from Merryfield and Dunsfold Park.

For the information to be valuable during the constraints of a race day, all the information has to be pulled together quickly – there’s not a lot of time to make changes in between the end of practice and the start of the race so every second counts. In order to maximise the utility of our data logging, I wrote some code in MATLAB that will read the data files, and generate a report with useful plots and calculations. I’ve uploaded two of these reports, from two different races at Rockingham to the website:

As an aside – I heartily recommend that any aspiring young engineer go out there and get some experience using MATLAB – it is easy to pick up and there is a huge wealth of help and support available online. As a data analysis and visualisation tool it far exceeds Excel, and will make a piece of work look far more professional! I use it extensively at work to perform simulations, automatically generate reports (automating a task that used to take hours keeps my manager very happy) and design control algorithms. From experience, I can also say that if I’d learnt to use it whilst at university, it would have made my dissertation project a whole lot more manageable, due to the Gigabytes of data that I was dealing with from incredibly high resolution measurements of impact data.

Sales pitch over! Once I’ve worked my magic with MATLAB and generated a report we can work out how much current and power we were using at any given point, and how fast we were running the motor. Using this approach with data from a run in practice, we can determine whether we can complete a full race distance at that pace without flattening our batteries (I’ve done plenty of battery testing, so I have a good understanding of how much energy the batteries have available).

Based on the data from the Rockingham heat, we were able to plan our power usage for the Lap Race – we estimated how much shorter it would be than the standard hour and then determined how much more quickly we could discharge the battery. If you look at the two reports linked above, you can see that we drew just under 25Ah from the batteries in both events, but at a higher average rate in the lap race.

Also shown in the reports are traces of throttle position and motor speed. Comparing the throttle trace from the Lap Race to that from the heat earlier in the year, it can be seen that Ian is performing fewer gear changes, and spending less time at part throttle. It can also be seen that motor speed tailed off much more quickly at the end of the Lap Race – we’re putting this down to the fact that we were using our best batteries in the Rockingham heat, but we saved them for the F24+ decider on the International Final weekend.

We’re planning to extend our data collection next year to include wheel RPM (from which we can calculate vehicle speed, and determine which gear we were in) as well as motor temperature, to avoid the risk of cooking another one! With this data we plan to be able to run an improved race strategy in the 2016 season – instead of targeting a constant rate of discharge from the batteries, we will be looking at how we can most effectively convert each unit of energy into speed.

Which brings me nicely onto the subject for my next post: Constant Current vs Constant Speed control!

weChook Racing: How we use data on circuit

Seeing as we’ve been espousing the virtues of data collection of late, I’ve decided I’d best write at least a bit about some of the things we do with our data.

I’m going to split this into two posts – the first covering how the driver uses the information during the race, and the second discussing what we do with the logged data in between sessions and race days, as well as what we’re hoping to achieve in the future.

From the Rockingham heat onwards, our cars were fitted with a screen that showed the driver a live readout of battery voltage, motor current and motor speed. Voltage isn’t much use on a moment to moment basis – it fluctuates with the current that is being drawn, meaning there’s no simple way to estimate the charge left in the battery

Motor RPM is also tricky to use – we know we need to keep the motor in its ‘happy range’ in order to keep power consumption low and stop the temperature from getting too high, but it’s difficult to plan a race using motor speed – without a good model of the motor, we don’t really know whether we need to hit 1750 rpm or 1800 rpm to make it to the end of the race!

That leaves battery current as the most useful resource to the driver. We’ve done plenty of testing, which shows that our best batteries have a capacity of roughly 25 Amp-hours, when discharged at a high current. For comparison, our worst batteries have a capacity of 22Ah, which can make a big difference when trying to reach the end of a race.

With 25Ah at our disposal, and an hours worth of racing to complete, the maths isn’t too hard; we need to hit an average of 25A over the course of the race to make sure we get to the end – simples!

With a single speed, relay controlled car, this is achieved through selecting the right gear ratio – get it wrong and you won’t reach the end of the race, or you will get there but at a slow pace. Choosing that gear ratio can be tricky – for me it came down to experience and voltage measurements. I’ll discuss more on this in the next post though!

Electric 2galoo had the luxury of a wide range of gear ratios, and a speed controller. By shifting up and down the gears and by varying the throttle input, Ian was able to target a constant rate of power consumption. At the International Final, this allowed us to control the rate that the battery went flat very nicely – gaining us a place on the last lap as the competition ran out of juice!

2galoo's current consumption from the international final

2galoo’s current consumption from the international final

We’re currently developing a data logging product that will be available for sale to all greenpower competitors – read more about it here – https://wechook.com/?p=511 . If you’re interested in investing in one, get in touch with us on twitter (@Ramjet_gpt) or on the greenpower forum here: http://www.greenpower.co.uk/forum/discussion/3398/introducing-project-echook-nano


weChook Racing – Greenpower Motor Testing part 2

Introduction

After testing two brand new Greenpower motors (https://wechook.com/?p=321) we borrowed the two motors that had been fitted to Project E and C-XeVolution for the last season.

We were aiming to determine how effective these motors were compared to the new pair and to each other.


Background

Over the course of the season, the two motors fitted to C-XeVolution and Project E had both covered hundreds of miles, so we wanted to determine whether there had been a significant gain or loss of performance from the extensive run in. Unlike C-XeV’s motor, nether of this season’s motor’s has been significantly overheated, however the motor from C-XeVolution did get warm at Castle Combe and the International Final, due to the hills.


Test Procedure and Equipment

The used motors were tested using the same equipment as the new motors. This time, we decided not to attempt the highest current draw using the heated seat pads, as the results were not reliable enough. In order to test at the higher currents, its likely that we’ll have to add more bulbs.


Results

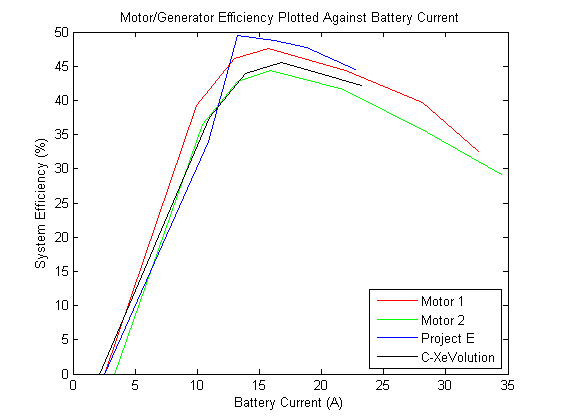
Shown below are two plots. The first shows a comparison of the 4 motor’s efficiency plotted against motor rpm, the second shows efficiency plotted against battery current.

Plot 1

RPMpart2

Plot 2

Currentpart2

Conclusions

When plotting the motor’s efficiency against current, C-XeVolution’s motor is comparable to the second new motor, however it must run much more quickly in order to achieve this efficiency. Evolution’s motor’s performance appears to be tending towards that shown by C-XeV’s motor in the last test report, suggesting that the extra heat it experienced at Castle Combe and Goodwood may have started to cause some damage.

Project E’s motor also appears to need to run at a higher speed in order to achieve its peak efficiency, although it is more efficient than the first new motor over most of the tested speed range.

It suggests that, if we had managed to the run the motor at ~2000 RPM, rather than ~1700RPM, we would have been in a much more efficient range.


Further Work

Further testing of the new motors after a more extensive run in will allow us to see how efficiency is affected by distance and thermal cycling. The motors will be cycled using a power supply to start with, and then run in anger once the rest of Ramjet is complete.

We also need to develop a more reliable method of testing the motor at higher duty, in order to better compare motors at the speeds they tend to experience during a race.

weChook Racing – Greenpower Motor Testing part 1

Introduction

As part of the development process for Ramjet, we have been testing a pair of brand new motors, as well as an old (and heavily abused) motor that was used in C-XeV –  Driven’s 2012 competitor.

The aim of the testing was to calculate the comparative efficiency of the two motors, and develop an insight into how the motors perform at different speeds and powers (and see what a really bad motor looks like as well!).

Background Information

During a Greenpower F24+ race, the motor is run using two 12V Lead Acid batteries wired in series to generate the required 24V. Bench testing has shown that an average current draw of ~22Amps or less is required to reach the end of a race without over discharging the batteries, or ‘falling off the cliff’. If the battery is discharged to the extent that the voltage begins to collapse, lap times at the end of a race can be severely compromised. This can be seen in C-XeVolution’s performance in the Greater London F24+ Heat, when compared to Project E. (504 compared to 711: http://bbk-online.net/gpt/lap213.htm)

Over the course of the race, Project E lost 6 seconds compared to its fastest lap, whilst C-XeVolution dropped nearly 40 seconds. In the race, C-XeVolution was consistently consuming an average of 24 Amps, whilst Project E was consuming 21 Amps.

On a race by race basis, current consumption is controlled by gear ratio. In order to most effectively select a gear ratio, a good understanding of the motor must be gained. Adding further complexity to the mix is the fact that the profile of each circuit varies so wildly. At Dunsfold Park, Project E’s current consumption stayed consistently between 18 Amps and 23 Amps, whilst at the National Final in gusty conditions, the current dropped as low as 15 amps on the main straight, and topped 35 Amps uphill. As such, simply investigating the motor performance at the intended average current would not be enough.

Test Procedure and Equipment

The electrical lab-car, built at the start of the year to develop and test Driven’s 2014 electrical system, was used to test the motors. The test motors were attached to another, spare motor, which acted as a generator powering a number of bulbs. The number of bulbs in the circuit, and thus the torque applied to the test motor, was controlled using a separate arduino board.

Using a current clamp and a voltmeter, we recorded the power into the drive motor, and out of the generator across a range of different output currents. We also used a tachometer to measure the motor’s shaft speed. It’s been assumed that at a given rpm, the generator’s efficiency will be same, independent of the motor being used to drive it. Thus by comparing the two new motors on a plot of efficiency against rpm, we can eliminate the efficiency of the generator from the equation.

Following the first test session, the motors were run in, unloaded and from a power supply, for 3 hours and 12V and 3 hours at 24V. Once the motors had been allowed to cool down after this, they were tested again. We decided to add some more load to the test rig for the second set of tests, to understand the efficiency at lower rpms/higher currents. These loads were not as stable in their power consumption as the bulbs however, and so there is less confidence in the results at a higher current.

Results

Below are three plots. The first shows the motor/generator system efficiency against motor RPM, and the second shows efficiency plotted against current output from the generator, which is broadly analogous to load on the motor when racing. The final plot is a repeat of the first, but with C-XeV’s motor included.

Plot 1

RPMnoCXeV

Plot 2

CurrentnoCXeV

Plot 3

RPMwithCXeV

Conclusions

Compared to the two new motors, C-XeV’s old motor ran at a significantly higher speed when unloaded. To achieve the same current output from the generator, it would require more current from the power supply than the new motors. Due to the higher speed of the generator, its voltage output was higher, masking somewhat the motor’s inefficiency. It is inarguable however, that it is less efficient at the speeds experienced during a Greenpower event that the two new motors.

When comparing the two new motors, there is a noticeable difference, with Motor 1 having an efficiency 5% or more greater than Motor 2. The margin increases towards the top end of the powers seen during a Greenpower F24+ event.

After the run in period, both motors showed a lower peak efficiency. The gap between the two motors at lower speeds decreased, and the peak efficiency for both motors appeared to be at a higher current. The second set of tests also showed the folly of allowing current to reach 30 amps or above. Efficiency quickly dropped off and the motor began to noticeably heat up.

Based on this testing, it appears that the motor’s peak efficiency lies between 13 and 16 Amps. It is also known, based on Peukert’s Law that a batteries effective capacity decreases the more quickly it is discharged (Have a look at wikipedia: http://en.wikipedia.org/wiki/Peukert’s_law, or Chipping Sodbury’s page: Greenpower Science).

To me, this suggests there may be an alternative race strategy, that involves running less aggressively, at peak motor efficiency and a low battery discharge rate, for a portion of the race, before moving to a low efficiency, high power mode for a blast to the line. Whether this strategy is quicker over the duration of a race would depend on the battery’s Peukert Constant, the change in motor efficiency at different currents, and the overall aerodynamic efficiency of the car.

Further Work

Further work will involve further running in of the motors, before another testing session, and performing the same series of tests on the motors fitted to Project E and C-XeVolution (Driven’s last two cars) for the 2014 season for comparison. Both motors have been well run in, and neither has been significantly overheated, which will make for an interesting comparison both to the brand new motors, and the very much overheated motor from C-XeV.

A new work stream opened up by this testing is to investigate the possible effectiveness of a split strategy, running slightly slower at a super high efficiency, to allow a final blast towards the end of a race. In order to determine the worth of this strategy, a better understanding of the battery and motor performance will be needed.